The United States imported 379 539 t of virgin olive oil in the 2020/21 crop year [1], 3% less than in the 2019/20 crop year.
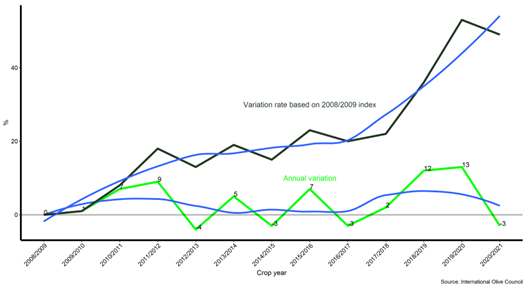
Graph 1 – US imports of olive oil
- Olive oil and olive pomace oil
The United States contributes to about 35% of world olive oil imports, beating the European Union (15%), Brazil (8%), Japan (6%) and Canada (5%)[2]. These latter four markets take up 69% of world imports

Graph 2 – Percentage of world imports of olive oil and olive pomace oil (average of 6 crop years).
The United States imported 390 534 t of olive oil and olive pomace oil in the 2020/21 crop year, or 1.6% less than the previous year. Table 1 shows US imports over the last seven crop years. Some 78.9% of US imports of olive oil come from Italy, Spain and Tunisia, followed by Portugal with 6.6% and Turkey with 4.5%.
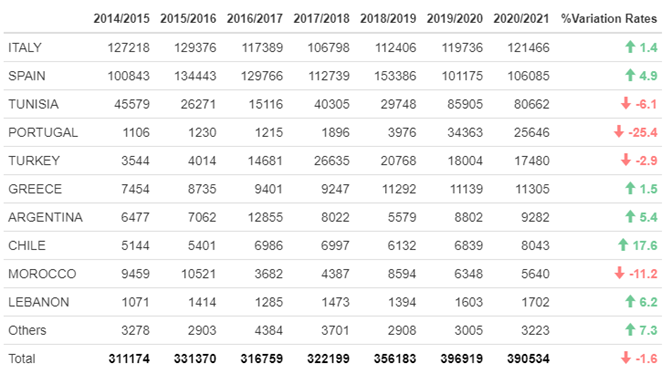
Table 1 – Olive oil and olive pomace oil imports by partner country (2014/15-2020/21) (t)
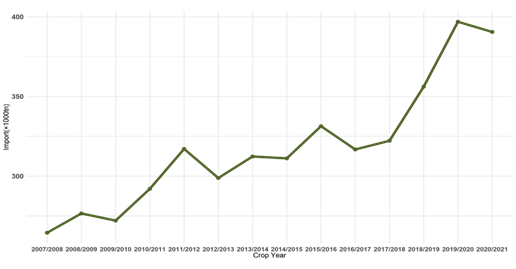
Graph 3 – Imports 2007/08-2020/21 (×1000 t)
By product category, 73% of imports fall under code 15.09.10 (virgin olive oil), 24.2% under 15.09.90 (olive oil) and the remaining 2.8% under 15.10.00 (olive pomace oil).
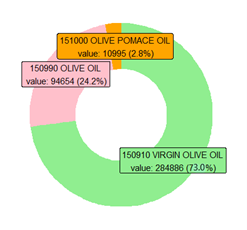
Graph 4 – Distribution of imports by product category – 2020/21 (t)
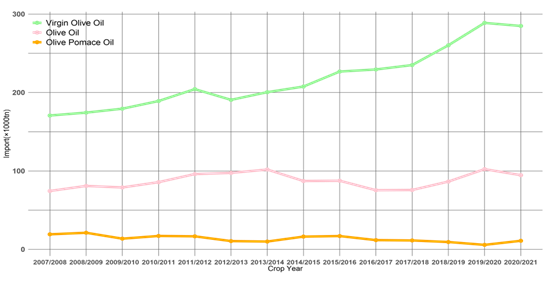
Graph 5 – Changes in imports by product category 2007/08-2020/21 (×1000 t)
As for the type of packaging used, Italy mostly used containers of less than 18 kg; only 7.1% of its containers were of 18 kg or more. Portugal, Greece, Lebanon, Israel and Syria were similar. Containers of 18 kg or more were used more than 75% of the time in Spain, Turkey, Chile, Morocco, Austria, the Netherlands, Australia and Egypt.
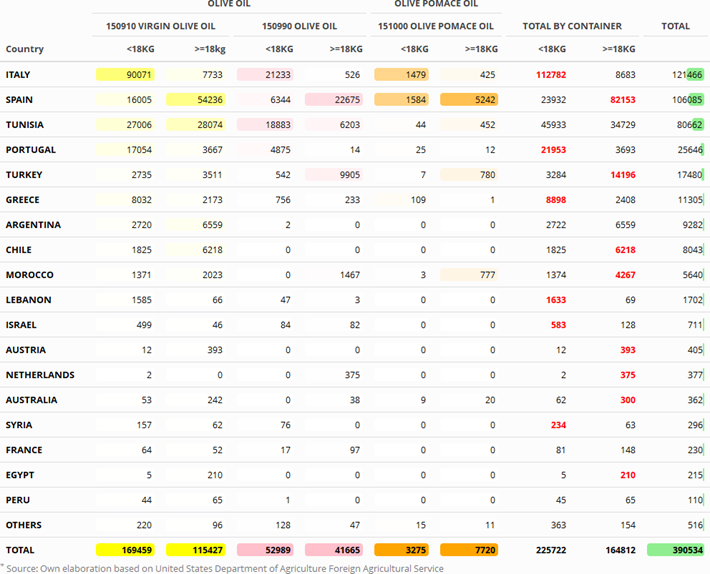
Table 2 – Distribution of imports by product category and partner country (2020/2021) (t)
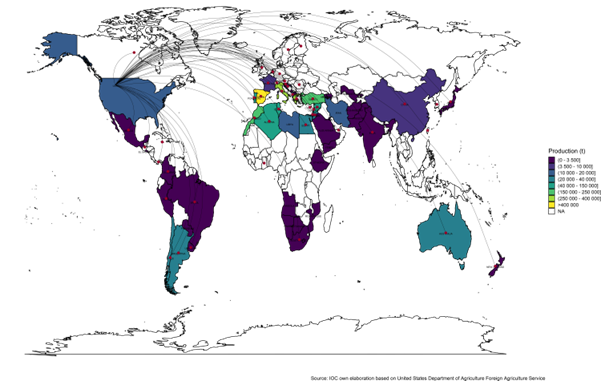
Map 1 – US import flows and world production – 2020/21, provisional data
Further information is available on this link: https://www.internationaloliveoil.org/what-we-do/economic-affairs-promotion-unit/#prices
[1] Provisional data.
[2] The United Kingdom was not included in the ranking.


