


Welcome to the IOC, the only intergovernmental organisation in the world to bring together all the stakeholders involved in the production and consumption of olive oil and table olives. Here you’ll find an overview of the latest sector statistics, including an update on olive oil prices, trends in international trade in olive oil and table olives, and producer prices for olive oil.
Follow us and visit our website to stay up to date with the latest data! Don’t hesitate to send us an e-mail if you have any questions (iooc@internationaloliveoil.org).
Per capita olive oil consumption
Per capita consumption of olive oil in some of the main importing markets remains well below 2 kg per crop year. Japan and Brazil each record just 0.4 kg per person, while the United States reaches 1.1 kg and Canada 1.2 kg. In the case of China, consumption is negligible in relation to the size of its population.
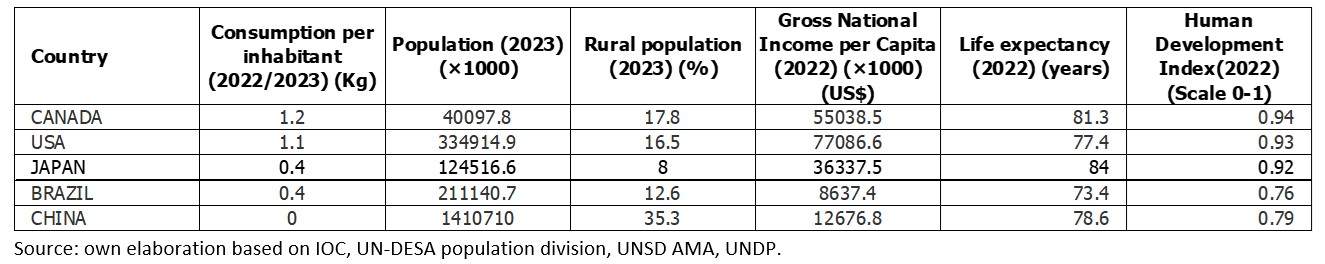
Table 1 – Estimated per capita consumption of olive oil in selected major importing markets.
In the 2022/23 crop year, among IOC member countries with per capita consumption above 3 kg, Albania stands out with 8.7 kg, followed by Morocco (4.0 kg), Lebanon (3.8 kg), Palestine (3.3 kg) and Israel (3.2 kg).
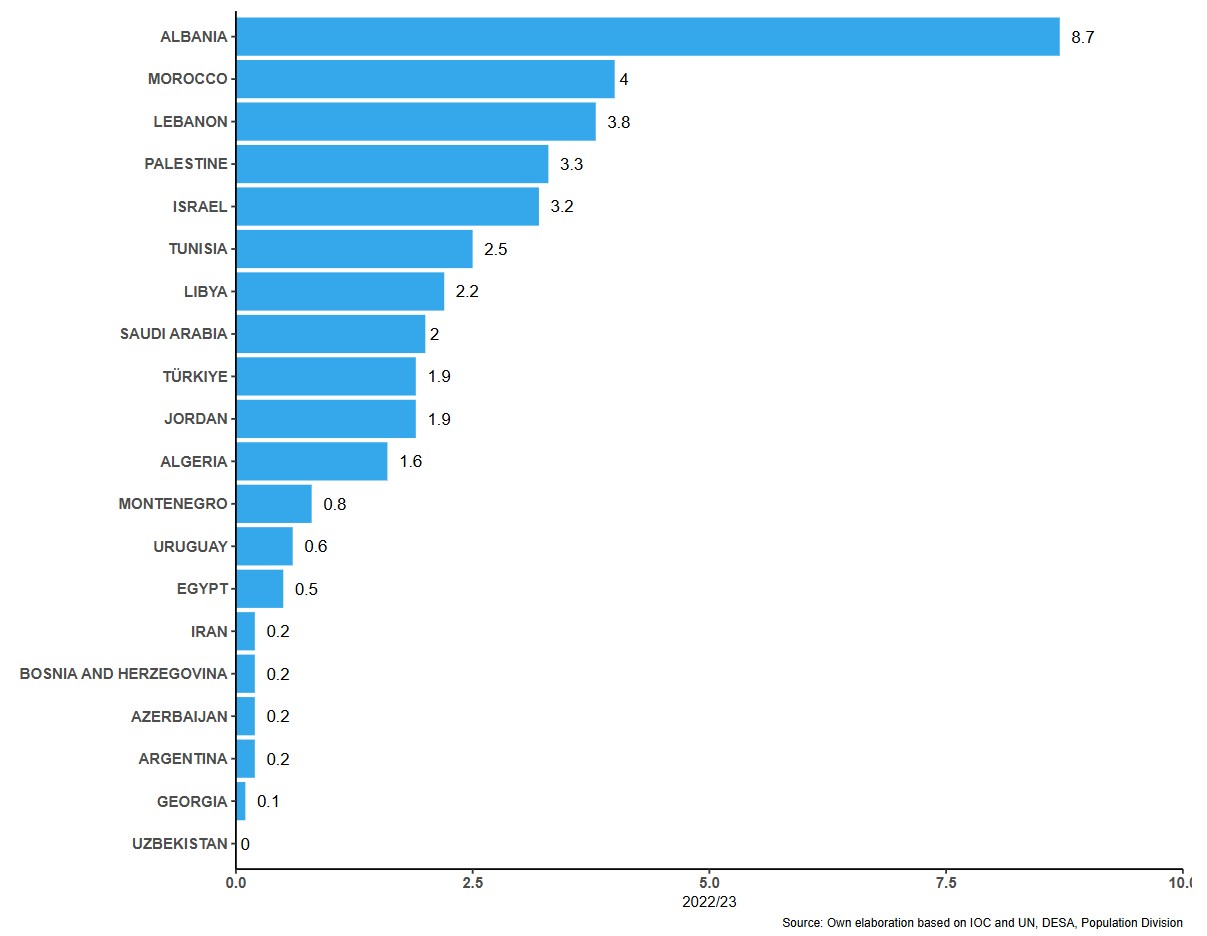
Chart 1 – Olive oil consumption per capita per campaign (in kg) in IOC member countries.
Among EU countries, Greece (9.3 kg), Spain (7.5 kg), Italy (7.4 kg), Cyprus (3.8 kg) and Portugal (3.7 kg) all recorded per capita consumption levels above 3 kg.
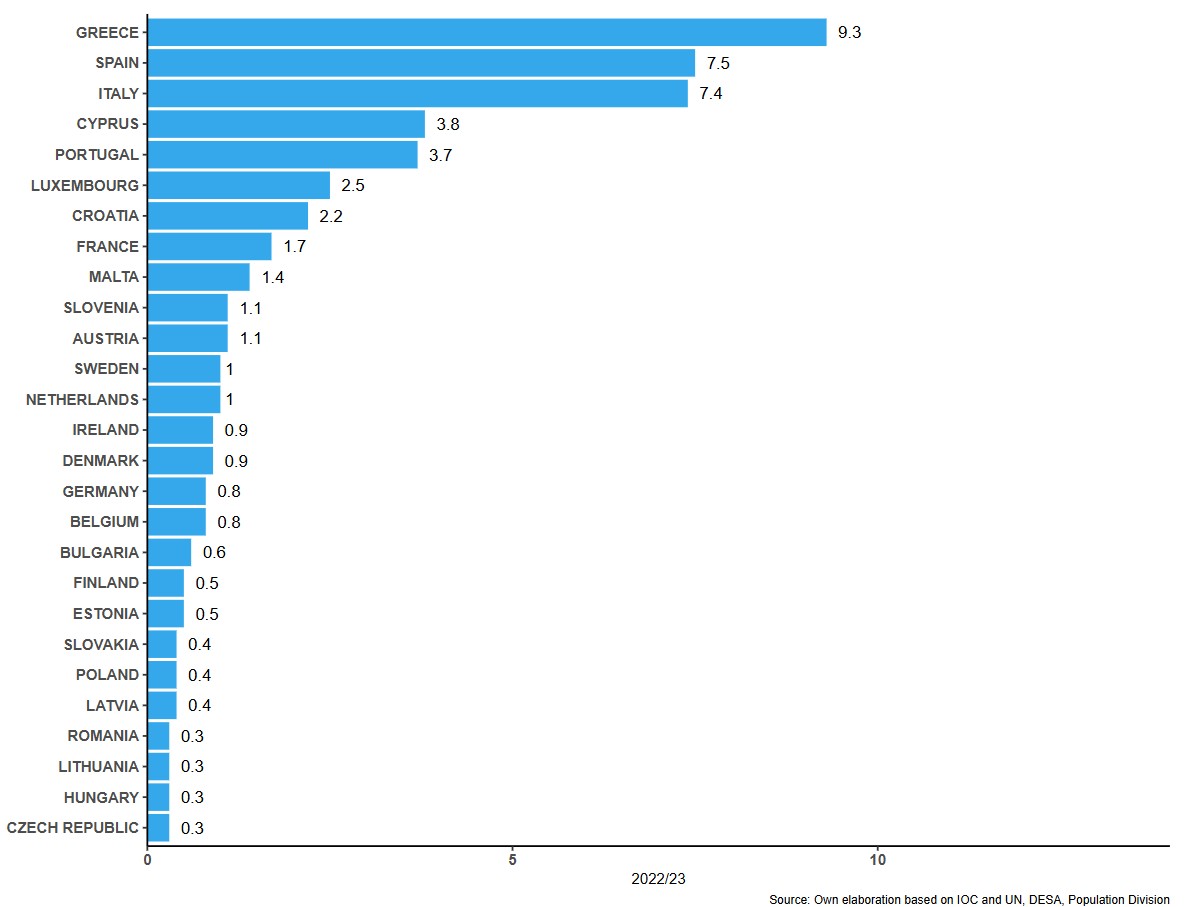
Chart 2 – Olive oil consumption per capita per crop year (in kg) in EU countries.
Among non-member countries, Syria recorded the highest per capita consumption, with an estimated 2.6 kg. Meanwhile, low consumption levels persist in some of the largest importing markets: Japan and Brazil each with 0.4 kg, the United States with 1.1 kg and Canada with 1.2 kg – all pointing to considerable growth potential. The combined population of these four countries exceeds 710 million people. Another potential growth market is China, with an estimated population of over 1.4 billion people and average consumption of around 53,000 tonnes.
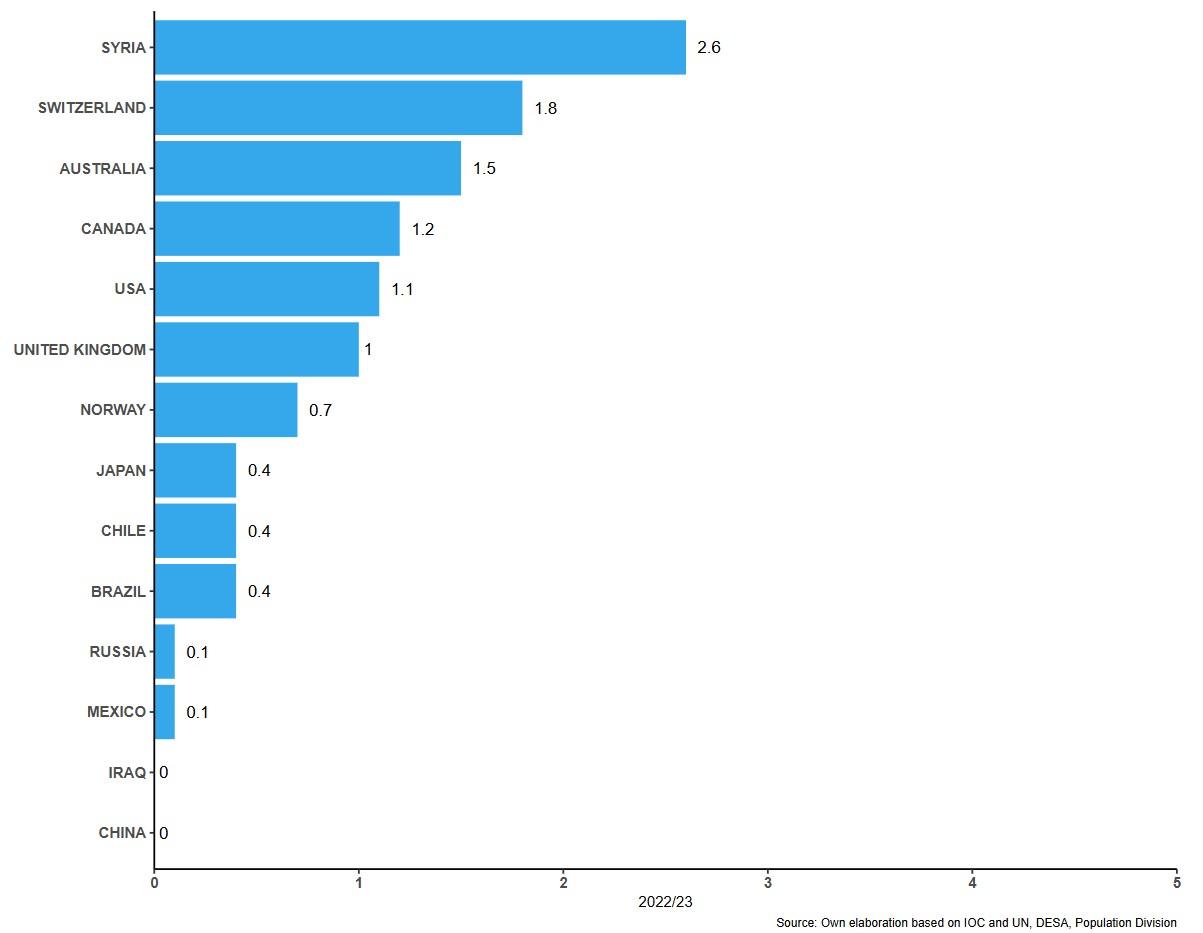
Chart 3 – Olive oil consumption per capita per campaign (in kg) in selected non-member countries.
Prices
As for extra virgin olive oil producer prices, figures for the penultimate week of March show that in Jaén (Spain), prices stood at €382.0/100 kg – 55% lower than during the same week of the previous year. In Bari (Italy), prices reached €930/100 kg (-4%), and in Chania (Greece), €425/100 kg (-49%).
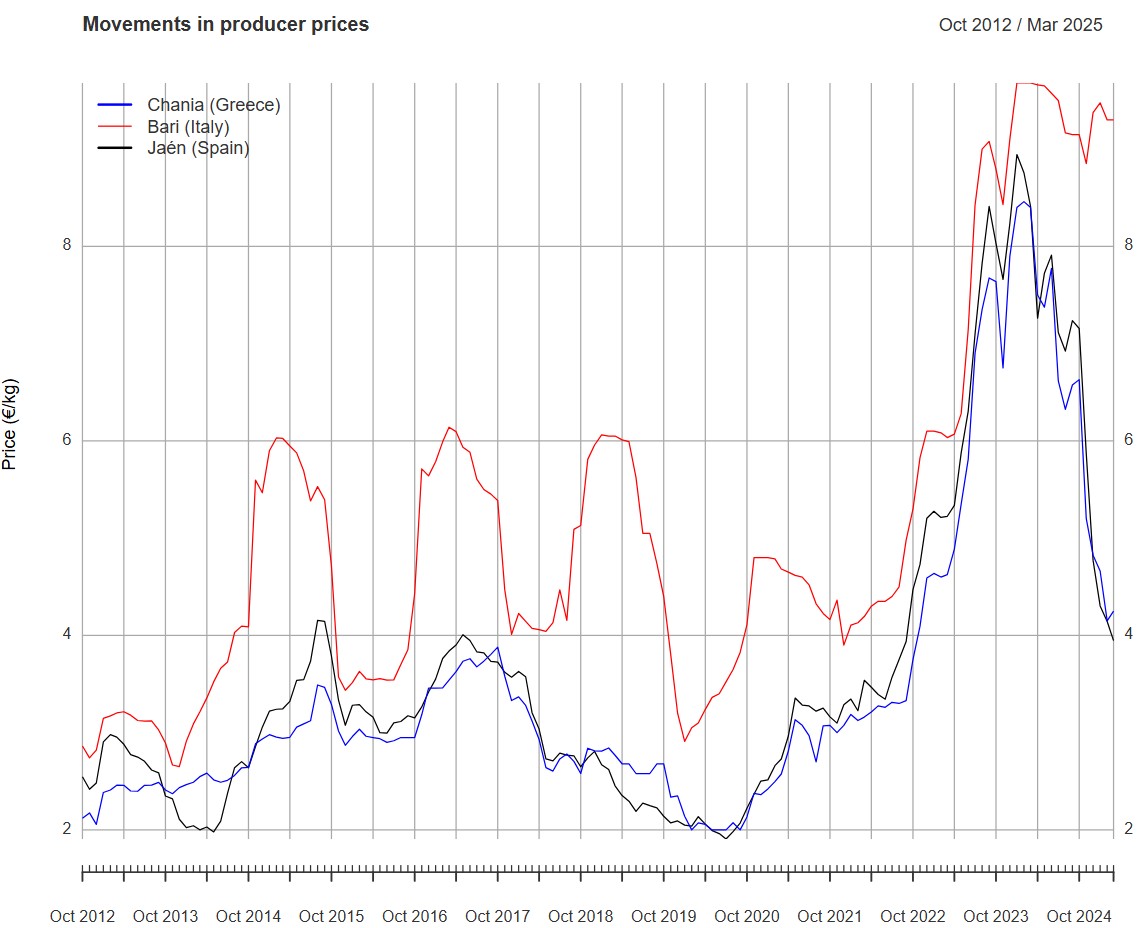
Chart 4 – Monthly price trends for extra virgin olive oil at origin.
Imports
Imports of olive oil into several major markets rose by 1.7% between October 2024 and January 2025, compared with the same period of the 2023/24 crop year. There is a notable recovery in the volume of imports from Australia, Canada and China.
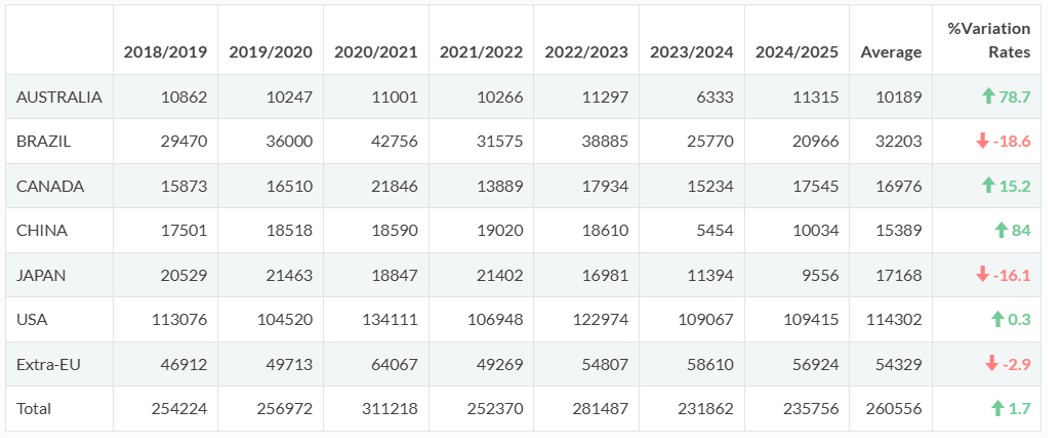
Table 2 – Olive oil imports in selected major markets. Volume in tonnes.
The main exporting countries were Spain, which accounted for 27.1% of the total, followed by Tunisia (24.9%), Italy (19.0%), Portugal (6.9%), Türkiye (9.5%) and Argentina (3.7%).
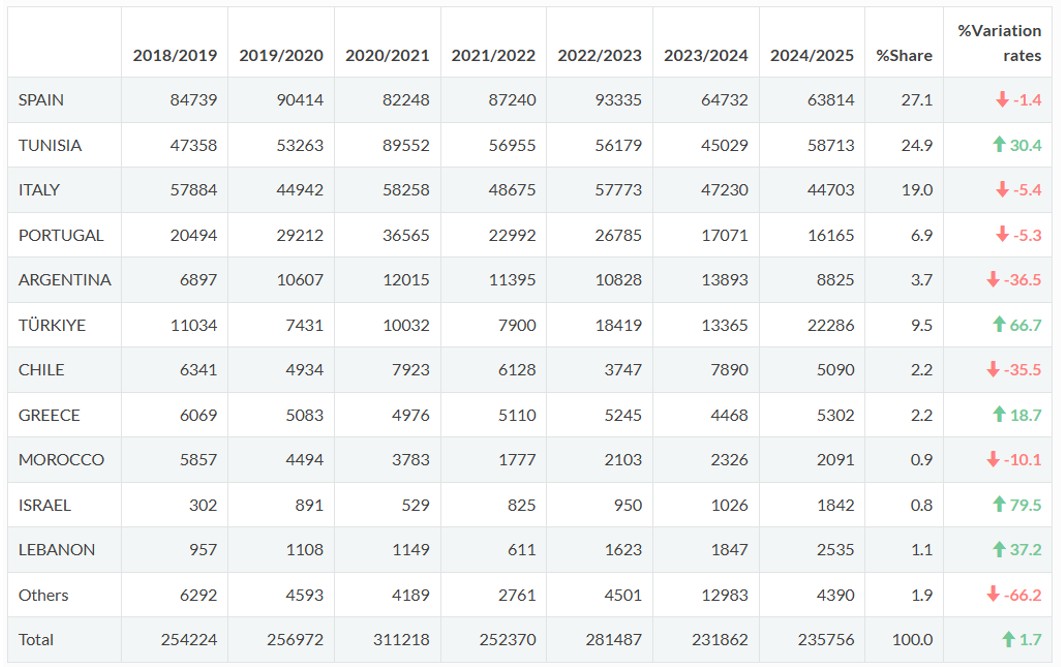
Table 3 – Partner countries. Volume in tonnes.
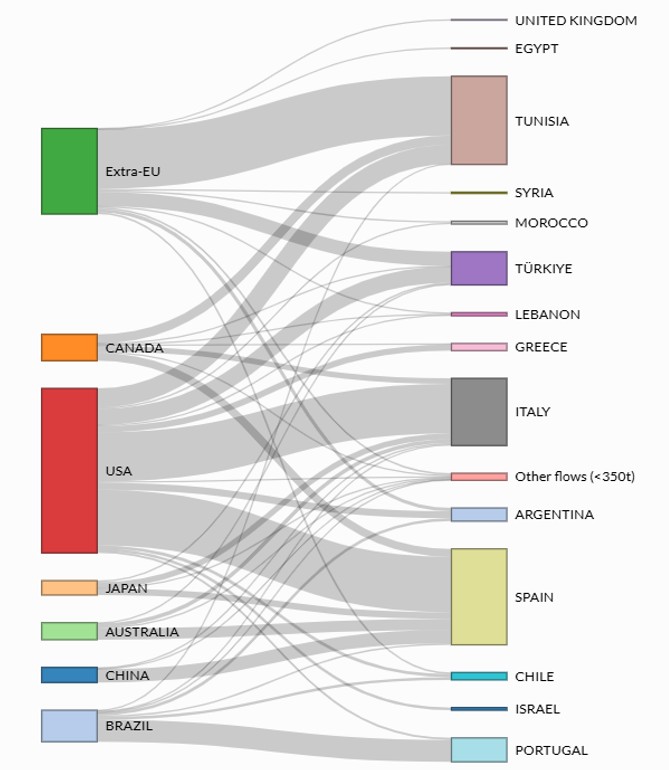
Chart 5 – Import flows between selected major importing countries and partner countries.
Some figures are subject to revision and may change without prior notice.