World olive oil imports fell by 9% in the 2020/21 crop year[1]; imports fell by 3% in non-IOC countries, which contribute to about 80% of total imports. Despite this, imports in the main markets were 100 000 tonnes higher than the average.
[1] Provisional data
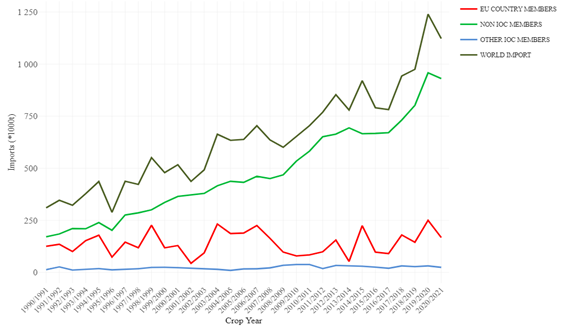
Graph 1 – Changes in olive oil imports
Eight of the main markets contribute around 80% of world imports of olive oils and virgin olive oils: the USA with 35%, the EU with 17%, Brazil with 8%, Japan with 6%, Canada with 5%, China with 4%, Australia with 3% and Russia with 2%.
In the 2020/21 crop year, imports from these markets fell by 10.8% compared to 2019/20, interrupting the up trend seen since 2016/17. Despite this, imports in 2020/21 remain 100 000 tonnes above the average for recent years.
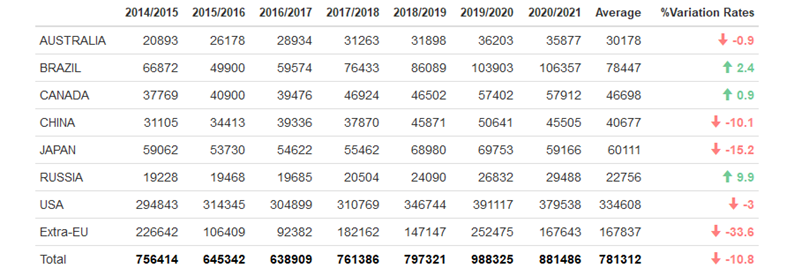
Table 1 – Changes in olive oil imports in some of the main markets
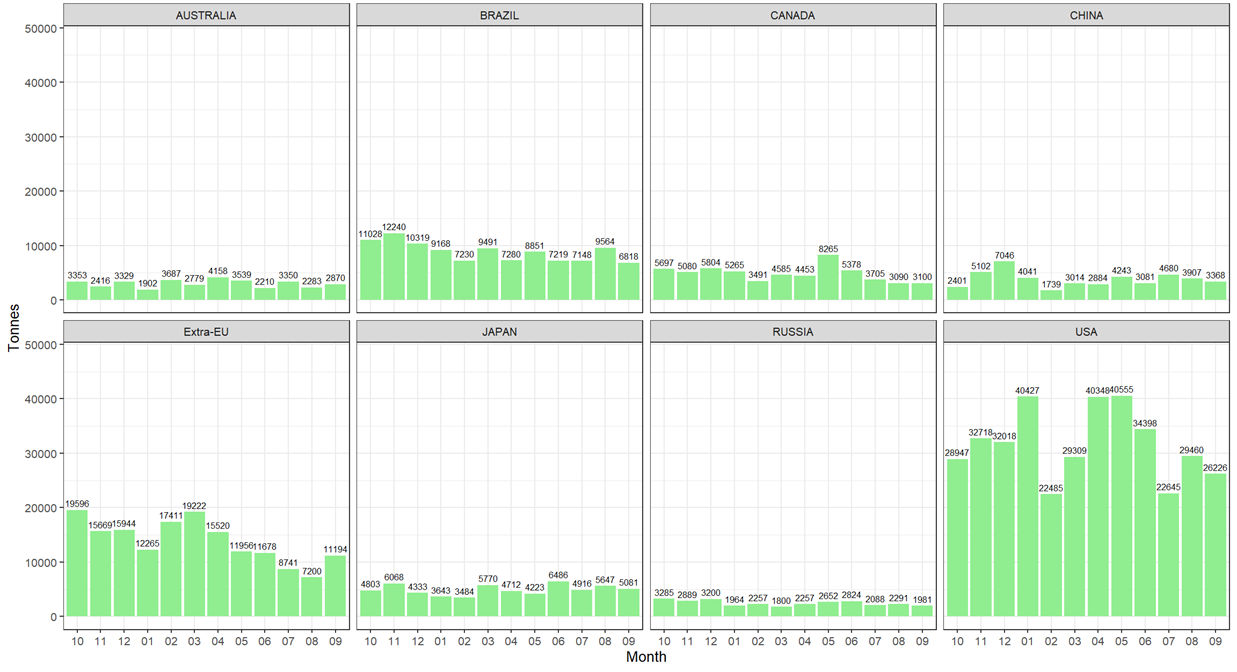
Graph 2 – Monthly changes in olive oil imports (2020/2021)
Imports come mainly from Spain, which contributes 29.2% of total imports (-2.9% compared to the same period of the previous crop year), followed by Tunisia with 26.8%, Italy with 20.4%, Portugal with 10.6%, Argentina with 3%, Turkey with 2.9%, Greece with 2.2%, Chile with 1.7% and Morocco with 1.2%.
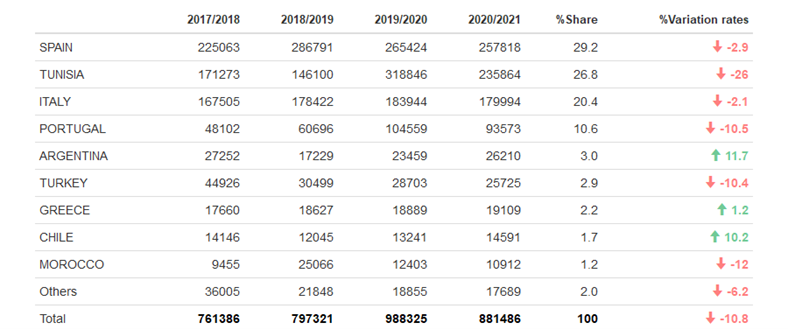
Table 2 – Changes in olive oil imports by country
About 75.8% of total imports fell under code 15.09.10 (virgin olive oil), 18.3% under code 15.09.90 (olive oil) and the remaining 5.8% under code 15.10.00 (olive pomace oil).
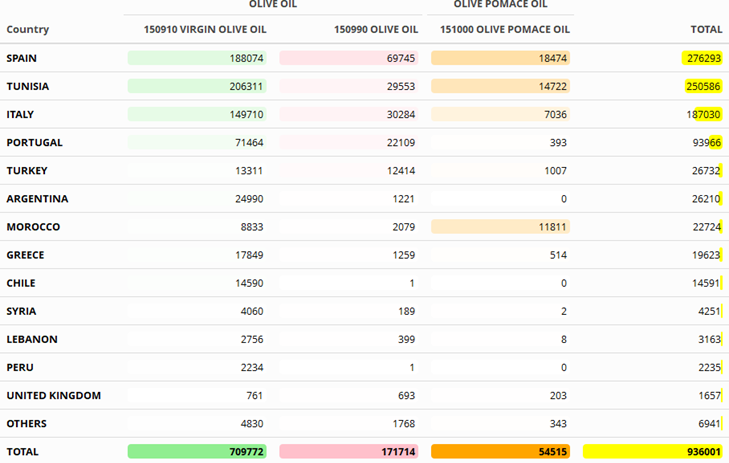
Table 3 – Imports in the main markets by partner country and by type of olive oil (2020/21)
Further information is available on this link: https://www.internationaloliveoil.org/what-we-do/economic-affairs-promotion-unit/#exports
