


Welcome to the IOC, the only intergovernmental organisation in the world to bring together all the stakeholders involved in the production and consumption of olive oil and table olives.
Here you’ll find an overview of the latest sector statistics, including an update on olive oil prices, trends in international trade in olive oil and table olives, and producer prices for olive oil.
Follow us and visit our website to stay up to date with the latest data! Don’t hesitate to send us an e-mail if you have any questions (iooc@internationaloliveoil.org).
United States: Olive Oil Imports
Olive oil imports in the United States (US) reached 362,618 tonnes in the 2023/24 crop year, representing a 1% increase compared to the previous crop year (provisional data).
During the first three months of the 2024/25 crop year, imports from the US increased by 4%, while Australia and China recorded a significant rebound in their import volumes.
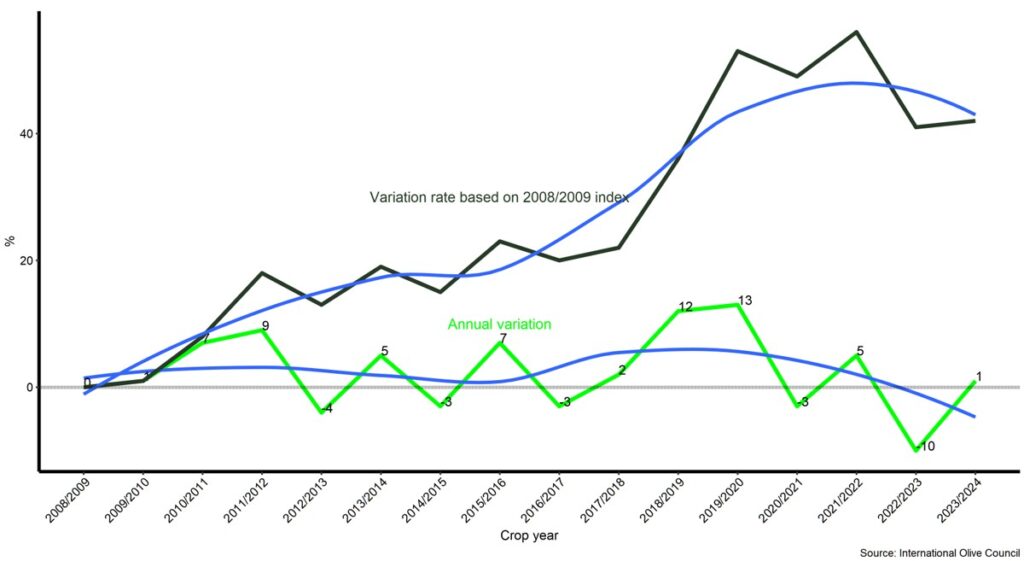 Graph 1: Evolution of olive oil imports in the US (annual variation rates and base 2008/09).
Main Suppliers and Types of Olive Oil
Over the past six years, Spain, Italy, Tunisia and Türkiye have been the main suppliers of olive oil to the US, collectively accounting for 86% of total imports. In the 2023/24 crop year, compared to the previous crop year, imports from:
- Spain increased by 9.8%
- Italy by 3%
- Tunisia by 50.3%
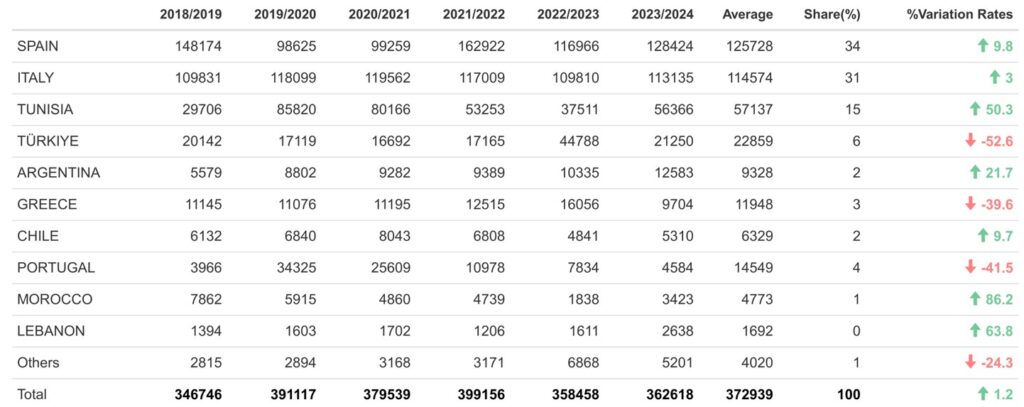
Table 1: Olive oil imports by partner country (2018/2019 – 2023/2024).
By category, 71% of imports correspond to virgin olive oils, 23% to olive oils classified under code 15.09.90, and the remaining 6% to olive-pomace oils.
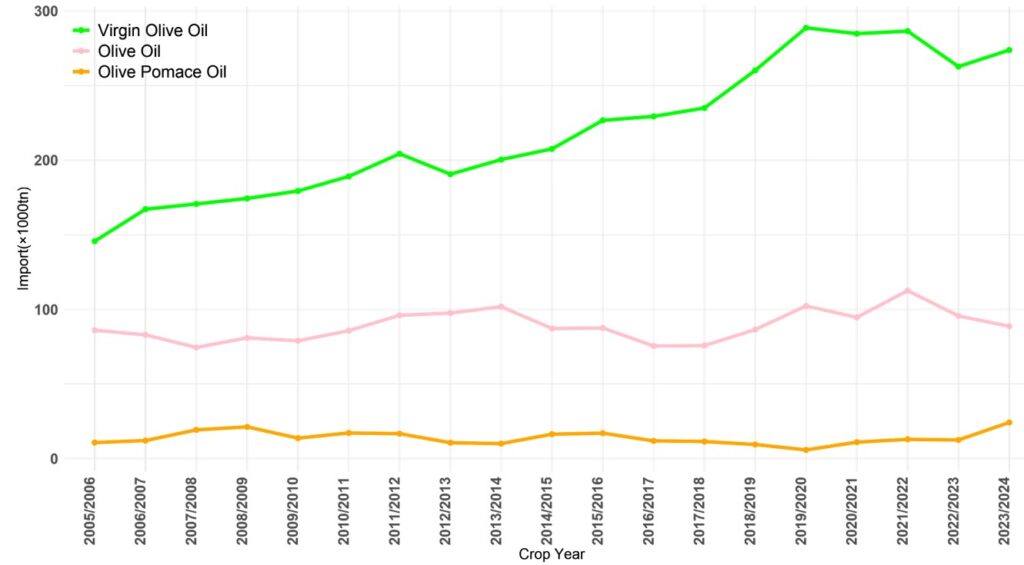
Graph 2: Evolution of imports by product type (2005/2006 – 2023/2024).
Regarding packaging type, Italy primarily uses containers of less than 18 kg, while those 18 kg or more account for only 10% of the total.
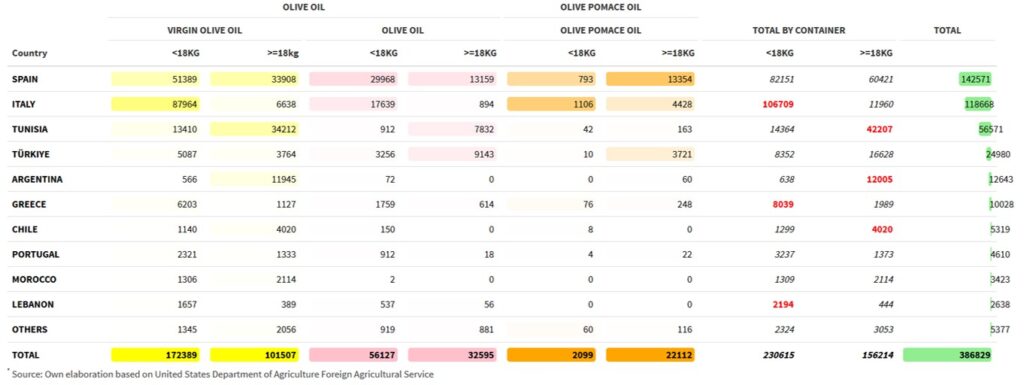
Table 2: Distribution of imports by product type and partner country (2023/2024).
European Union: Exports to the US
The European Union (EU) is the main supplier of olive oil to the US, with an average of 252,000 tonnes exported per crop year, with an estimated value of €1.228 billion.
- Extra-EU exports to the US account for approximately 35% of total volume and value.
- Including intra-EU exports, they represent 15% of total volume and 17% of total value.
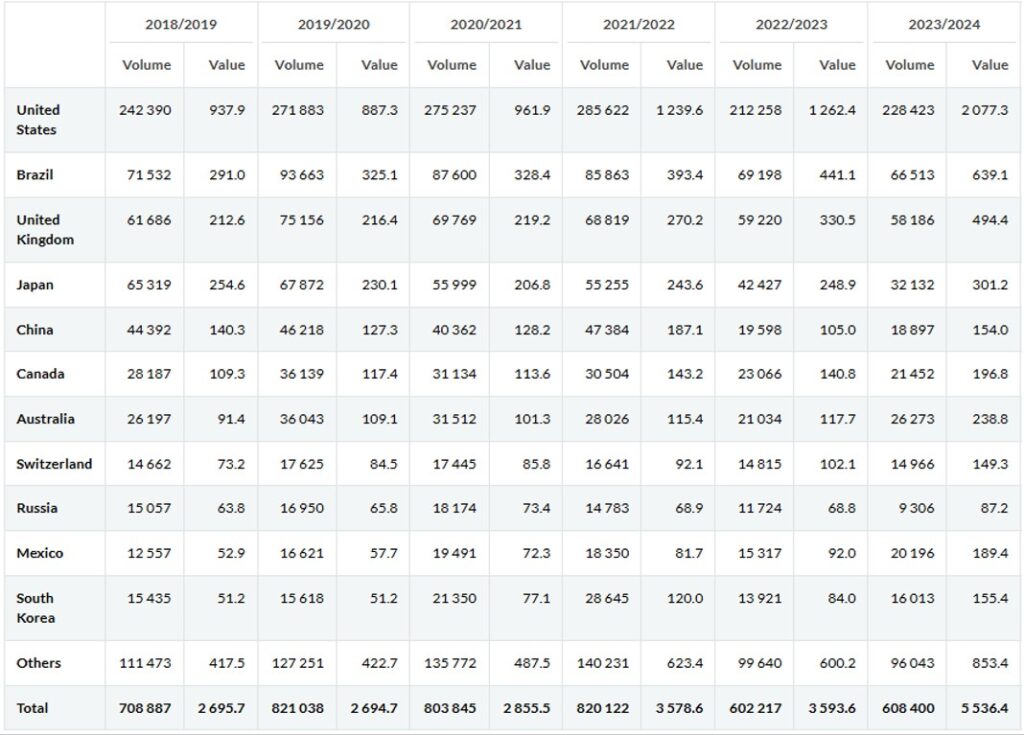
Table 3: Evolution of extra-EU exports by partner country (volume in tonnes, value in million euros) – Provisional 2023/2024 data.
In the 2022/23 crop year, EU exports fell by 25.7%, but the value remained stable compared to the previous crop year. According to provisional data, in 2023/24, the export value increased by 64.6% compared to the previous year.
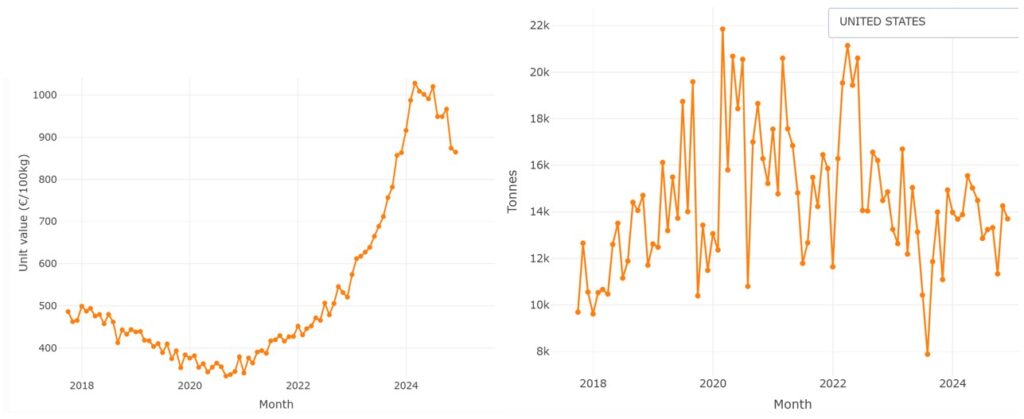
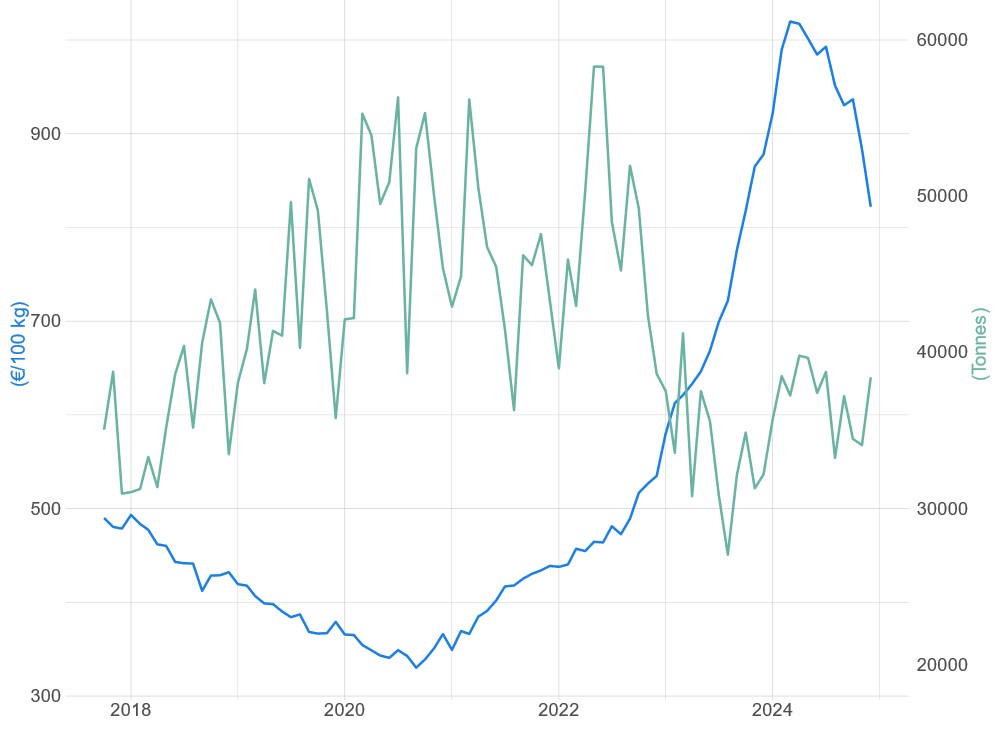
Graph 3: Monthly evolution of EU exports to the US (Value in €/100 kg, volume in tonnes).
The unit value of EU exports to the US reached its peak in July 2024 at €987.8/100 kg, compared to €517.9/100 kg in December 2022 and €298.8/100 kg in September 2020.
Olive Oil Prices
Extra virgin olive oil producer prices for the last week of February 2025 were:
- Jaén, Spain: €407.5/100 kg (-54% compared to the same week of the previous crop year).
- Bari, Italy: €930/100 kg (-4%).
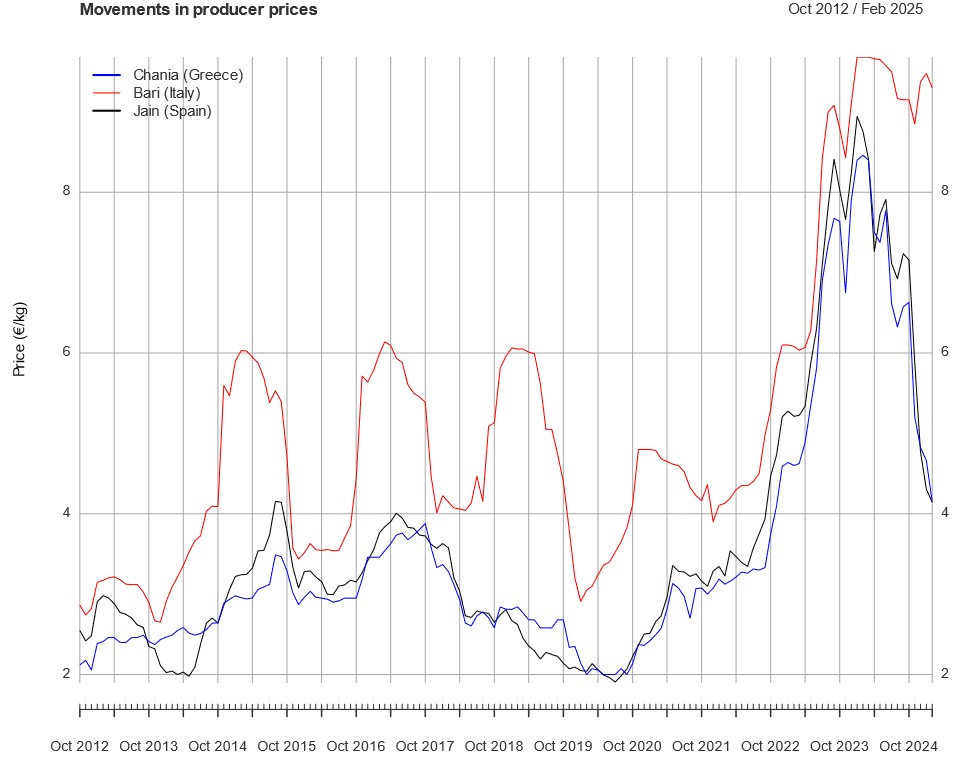
Graph 4: Monthly evolution of extra virgin olive oil prices at the mill.
Exports and Imports
- In December 2024, the unit value of extra-EU exports stood at €789/100 kg, representing a -5.2% decrease compared to the same period of the previous crop year and -6.7% compared to the previous month.
- For extra virgin olive oil, the unit value was €822/100 kg.
Graph 5: Monthly evolution of the unit value (FOB) and volume of extra-EU exports of extra virgin olive oil.
The unit value index of exports fell for the ninth consecutive month, with a 7% drop in December compared to the same month of the previous year.
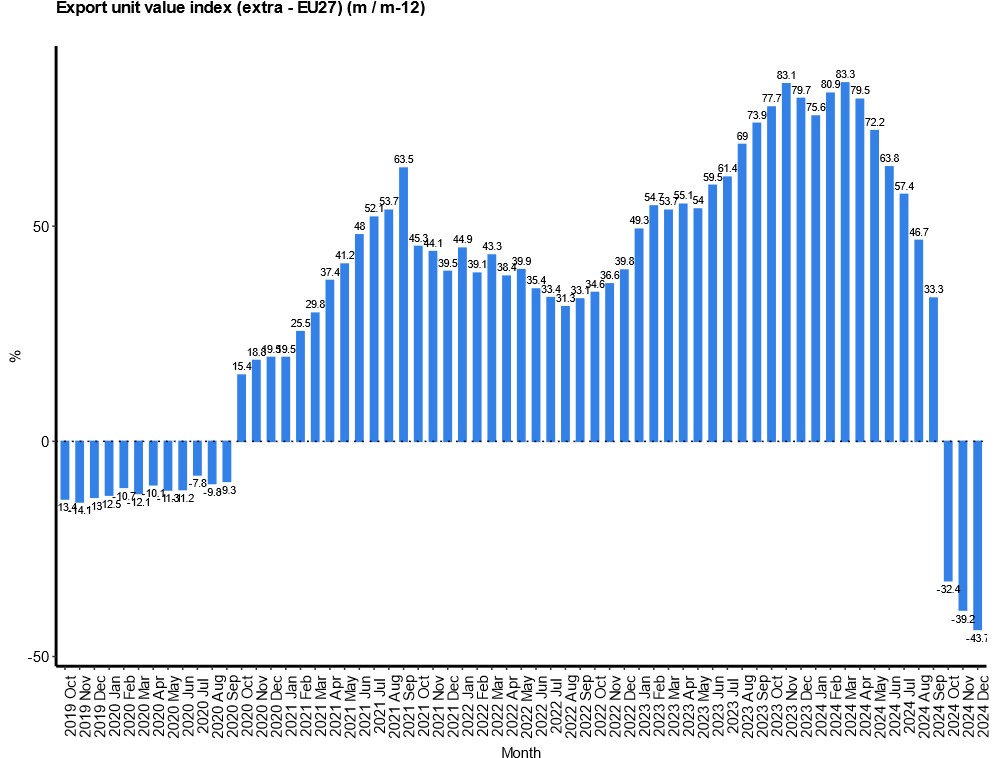
Graph 6: Evolution of the unit value index of extra-EU olive oil exports. Variation rate (m/m-12) (%)
Olive oil imports in some of the main markets decreased by 0.5% between October and December 2024, compared to the same period in the 2023/24 crop year. However, a recovery in import volumes is observed in Australia, China and the US.
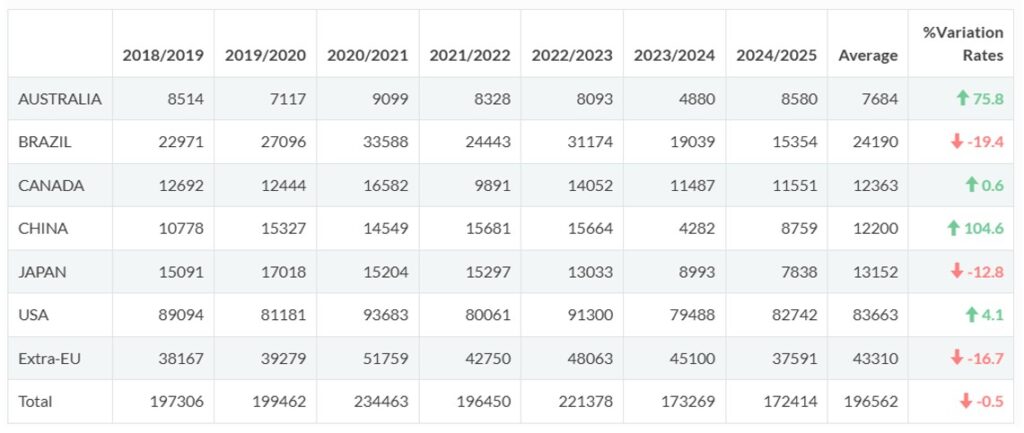
Table 4: Olive oil imports from some of the main markets (Volume in tonnes).
Harmonised Consumer Price Index (EU-27)
The Harmonised Consumer Price Index (HICP) for olive oil in the EU-27 increased by 1.5% in December, compared to the same month of the previous year. However, the growth rate was lower than in November (-4.2%). The index has been declining since April 2024.
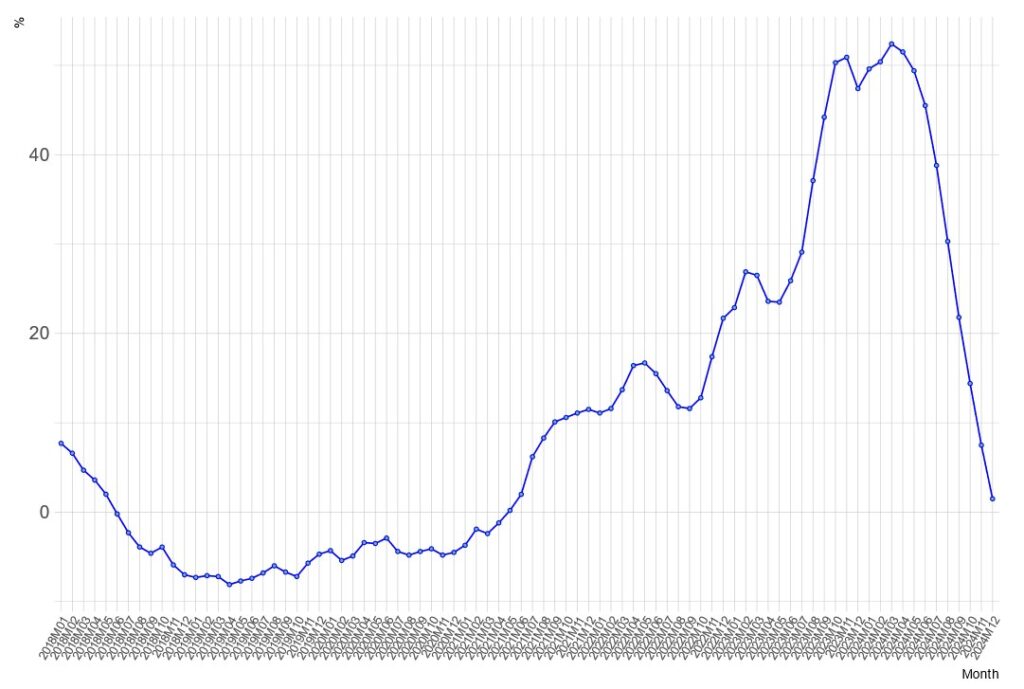
Graph 7: Evolution of the HICP for olive oil in the EU-27. Variation rate (m/12-12) (%)
Click on these links to read more about olive sector prices, exports, and other relevant information.
🔗 Economic Affairs and Promotion Unit – IOC
🔗 Exports and Trade – IOC
🔗 Sector Statistics – IOC
Some data are subject to revision. Figures may change without prior notice.